Carbon footprint
Our carbon footprint has been calculated according to the GHG Protocol. We developed a carbon roadmap in collaboration with Gaia. The carbon roadmap identifies the most significant impacts of our operations and ways to reduce our footprint.
Our goal to reduce our carbon footprint aligns with SBTi, but SBTi does not certify goals for foundations. For example, we have not set a carbon neutrality target, as it is not currently feasible to achieve full carbon neutrality using the available methods without creating significant pressure to raise rents.
Our total carbon footprint in 2023
The carbon roadmapShowClose
The carbon roadmap outlines the actions needed to reduce emissions to the desired level. Our carbon roadmap is still somewhat rough, as we are still investigating the most effective ways to reduce our carbon dioxide emissions. Nevertheless, we are committed to SBTi’s emission reduction targets. While SBTi verifies the targets, it does not certify them for foundations. Therefore, our goal cannot be verified by SBTi.
We are not currently striving for carbon neutrality, as this would practically require emission compensation. Emission compensation is currently a significant cost for a non-profit foundation and would reflect on tenant rents. Furthermore, there are uncertainties about whether emissions are truly compensated as intended, and planning and monitoring compensation would also require personnel resources.
Emission intensityShowClose
Currently, our largest source of emissions is fixed assets – that is, construction and renovation activities (7,355 tCO₂e). Thus new construction and renovation have a significant impact on our carbon footprint – during years when we build and renovate more, our emissions are higher.
Our emissions calculations only account for the year a building or renovation project is completed, which results in considerable variation between years.
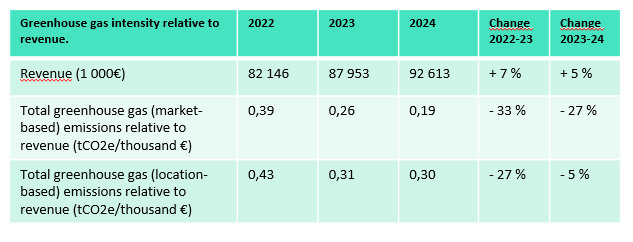
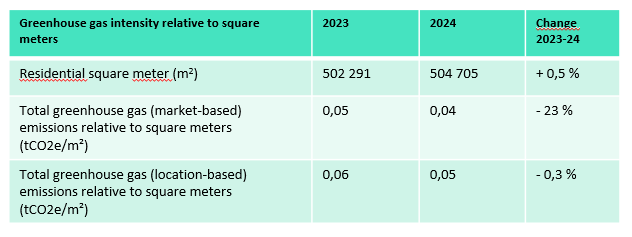
To address this, we also calculated our emissions intensity based on revenue and residential floor area. This allows us to monitor the development of our carbon footprint regardless of annual fluctuations in construction activity. This way, we can ensure that the overall direction of our carbon emissions stays on the right track, despite short-term variations.
Scope 1ShowClose
Scope 1 includes direct emissions from the company’s own operations. These include, for example, the fuel used by company cars or purchased computers and phones. These emissions are often the easiest to address because they are directly linked to the company’s operations.
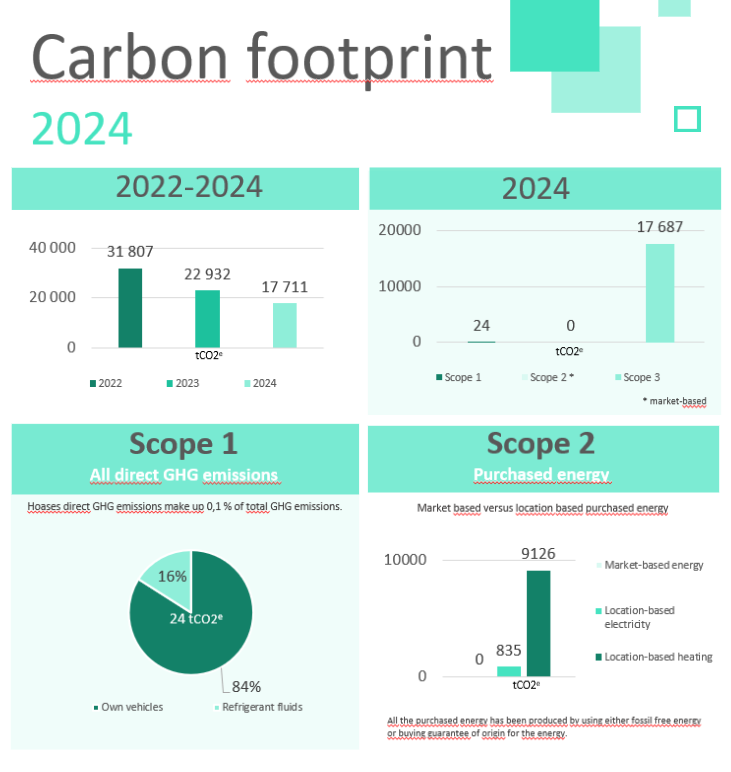
Total Scope 1 emissions
Scope 1 emissions account for 0.1% (24 tCO₂e) of our total carbon footprint. In 2023, these emissions amounted to 43 tCO₂e, meaning emissions in this category have decreased compared to the previous year.
Main sources of Scope 1 emissions
- Fuel consumption: 20 tCO₂e (84%)
- Refrigerant leaks: 4 tCO₂e (16%)
- Biogenic emissions: 1.3 tCO₂e
Actions to reduce emissions
At present, it is not crucial to take major actions to reduce Scope 1 emissions, as 99.9% of our total emissions come from other sources. It is more efficient to focus on small, low-cost improvements where possible.
Scope 2ShowClose
Scope 2 includes purchased energy – essentially the electricity and heating bought by Hoas.
Total Scope 2 emissions
Scope 2 accounts for 0% of our total emissions, or 0 tCO₂e, based on the market-based calculation method. In 2023, purchased energy emissions were 7,738 tCO₂e, so emissions have decreased.
Market-based calculation uses the emission factor provided by each energy supplier. Since Hoas purchases all its energy either from fossil-free sources or by acquiring renewable energy certificates equal to our consumption, the emission factor is zero.
If the location-based method were used – applying national average emission factors regardless of energy source – the emissions in this category would be 9,960 tCO₂e. Currently, Hoas’s largest single emission source is fixed assets, which account for 7,355 tCO₂e. Therefore, if we did not use renewable energy, purchased energy would be our largest emission source.
Main source of Scope 2 emissions
- There are no emissions in Scope 2.
Actions to reduce emissions
As of October 2023, all purchased energy has been sourced from renewable energy providers, making it zero-emissions.
Scope 3ShowClose
Scope 3 includes all indirect emissions that occur in the value chain, such as emissions from purchased goods and services, waste and water management, and the use of sold products. It also includes fixed assets, meaning emissions from construction and renovation. Scope 3 is divided into 15 categories.
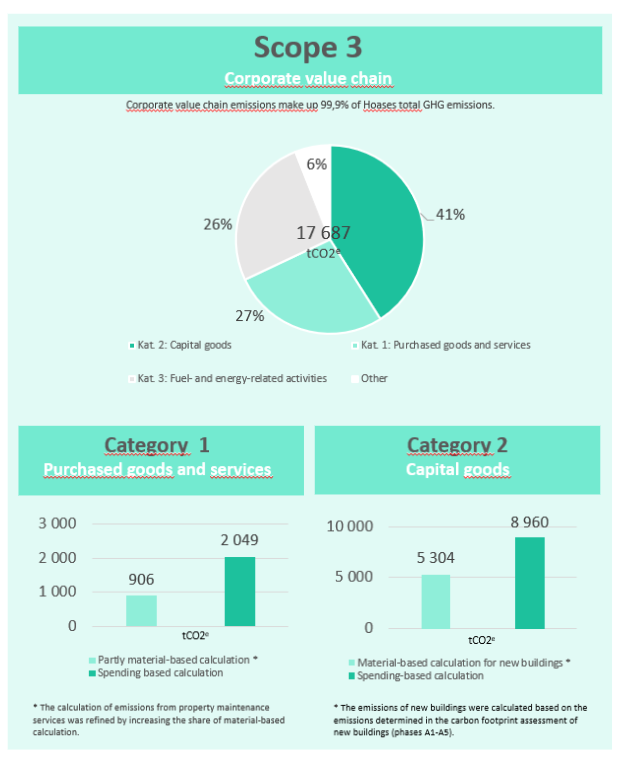
Total Scope 3 emissions
In 2024, Scope 3 emissions accounted for 99.9% of Hoas’s total emissions, or 17,704 tCO₂e. In 2023, Scope 3 emissions were 15,152 tCO₂e – so emissions have increased.
Main sources of Scope 3 emissions
- Fixed assets (construction and renovation): 41% (7,355 tCO₂e)
- Purchased goods and services: 27% (4,793 tCO₂e)
- Energy production: 26% (4,593 tCO₂e)
Actions to reduce emissions
To reduce construction-related emissions, we follow a low-carbon construction guideline that influences the carbon footprint of our new buildings. In 2024, the emissions of both new development projects were calculated based on project-specific emission assessments rather than general coefficients. This made our calculations more accurate and resulted in a 69% reduction in emissions compared to using standard emission factors.
A major source of emissions is also the procurement of goods and services, such as emissions from property maintenance providers. Our goal is to improve supplier-specific emission reporting among our major partners. This enables us to create targeted emission reduction pathways based on the services we purchase. In 2024, several of our partners provided their supplier-specific emissions data for our carbon accounting. As a result, the estimated carbon footprint of property maintenance was reduced from 2,049 tCO₂e to 906 tCO₂e.
In practice, the difference between material-based calculations and cost-based calculations is that the cost-based methods do not account for what is actually purchased. For example, switching to electric vehicles might increase costs, which in turn inflates emissions in cost-based calculations, even though actual emissions decrease. Material-based methods reflect how money is spent and what actual emissions lie behind each used euro.
Emissions from energy production are difficult to influence directly with the tools currently available. They are caused, for example, by the construction of infrastructure needed for energy production. The only realistic way we can impact these emissions is by improving energy efficiency, thereby reducing overall energy consumption. We are making efforts to improve our energy efficiency constantly.
Glossary
GHG Protocol The Greenhouse Gas Protocol is a global standard for unifying the way carbon dioxide emissions are calculated, making it easier to compare and assess emissions.
SBTi The Science Based Targets initiative refers to measures aimed at limiting global warming to 1.5°C.
Carbon neutrality Carbon neutrality means operations that do not increase the carbon concentration in the atmosphere.
Emission compensation Emission compensation refers to offsetting the emissions generated by capturing an equivalent amount of carbon dioxide elsewhere, for which a designated price is paid.
tCO2e Tons of Carbon Dioxide Equivalent, a unit used to measure greenhouse gas emissions based on their warming effect on the climate.